
Rishiraj Adhikary

Sumit Kanu
3 min read.
As sensor deployment is gradually increasing in our campus, so is the need for these sensors to communicate with a central database. The distance between these sensors and the database range from 300m to about a Kilometer. It is not feasible to come up with an ethernet port in each sensor site and even the cellular network penetration is poor.
Since our requirement of communication is low bandwidth and high distance hence Lora appears to be a solution to our deployment challenge. But before we start deploying Lora transmitter, we wanted to do some experiments with our Lora module and test its performance in various conditions.
For these experiments, we used the Dragino Lora GPS Hat (Fig 1) which has the SX1276 Lora circuit and works at a carrier frequency of 868Mhz. We used the same code as listed in Dragino’s “Two RPI use Lora to transmit” example.
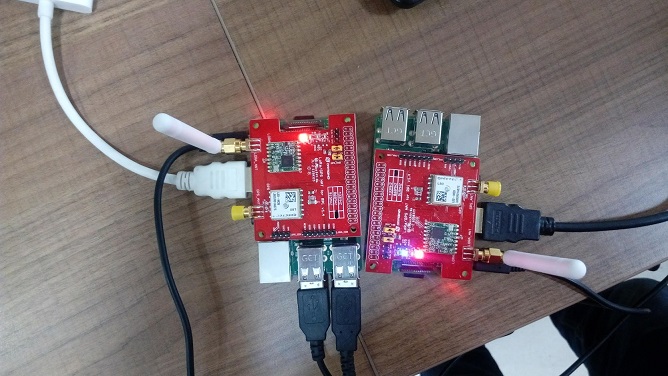 Fig 1: Lora GPS Hat fixed in Raspberry Pi
Experiment 1 To observe the behavior of receivers’ packet strength as the distance between transmitter and receiver changes.
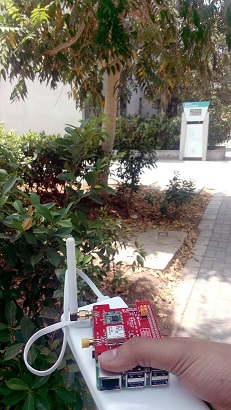 Fig 2: The Receiver Lora GPS Hat With Rpi, 267m Away From The Sender
How we performed the experiment? Observe the snapshot of Google Map below (Fig 3). One of our interns, Sumit was holding the transmitting Lora Module at the point S. Holding the receiver Lora module, I gradually started moving away from the transmitter. I reached Point 1 (128m away from the transmitter) and thereafter Point 2 (168m), Point 3 (219m) and Point 4 (268m). I stayed stationary at each of the points for about 1 minute before returning to Point S. The data obtained can be found here.
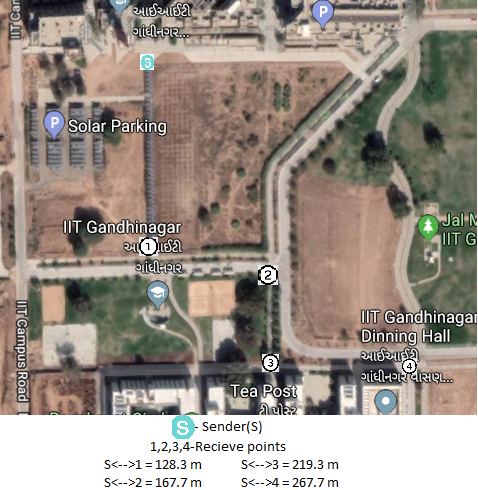 Fig 3: A Google Map Snapshot showing the location of Sender and Receiver Lora Module at IIT Gandhinagar Campus
The Raspberry Pi (with Lora connected) was drawing power from a power bank (Fig 2). The Pi was set up in such a way that the transmitting script and the receiving script auto-started as soon as the pi boots.
Observations and Discussions
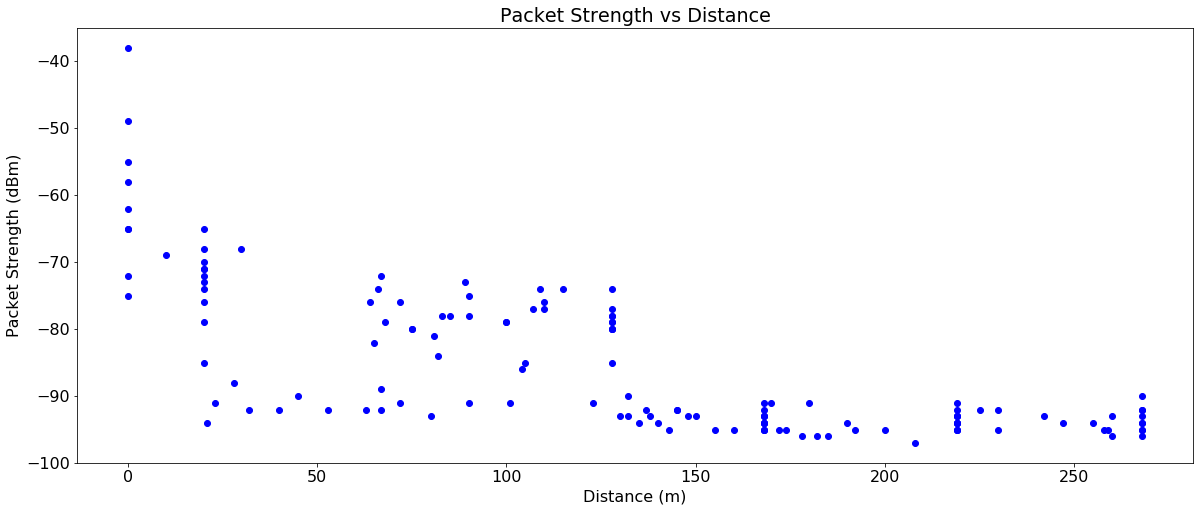
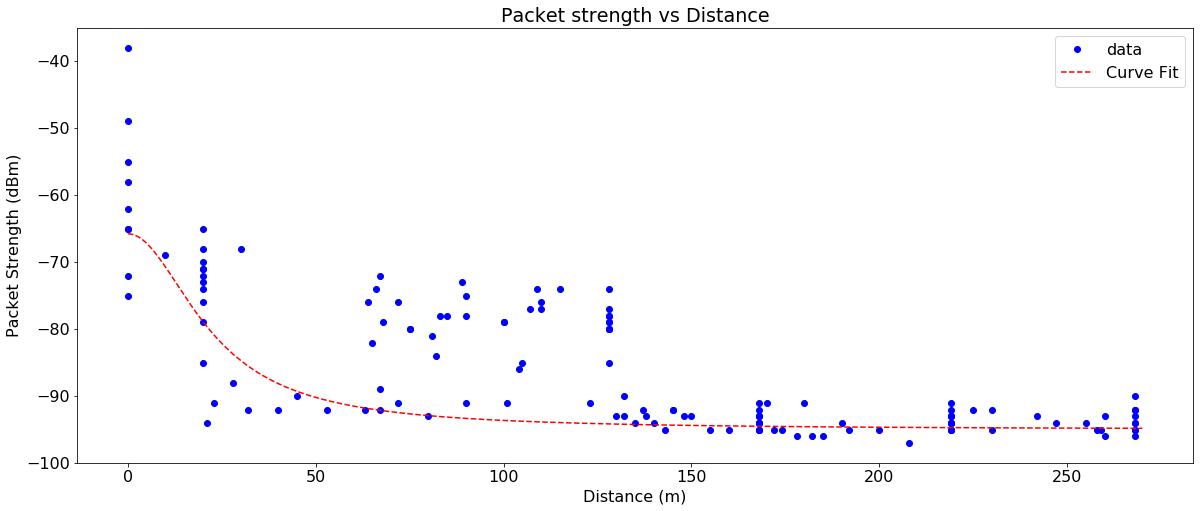
- We observed from the Packet Strength vs Distance plot that the packet strength decreases as the distance between transmitter and receiver increases. The Packet Strength vs Distance plot appears to be following the Inverse Square Law. To verify this, we tried to perform a curve fitting using SciPy. We used the following inverse law function with parameters
a,bandc. The parameters had a learned value of 14396.87, 492.65 and -90.11 respectively.def inverseLaw(x, a, b,c): return (a*(1/(x**2+b)))+cWe got the following result:
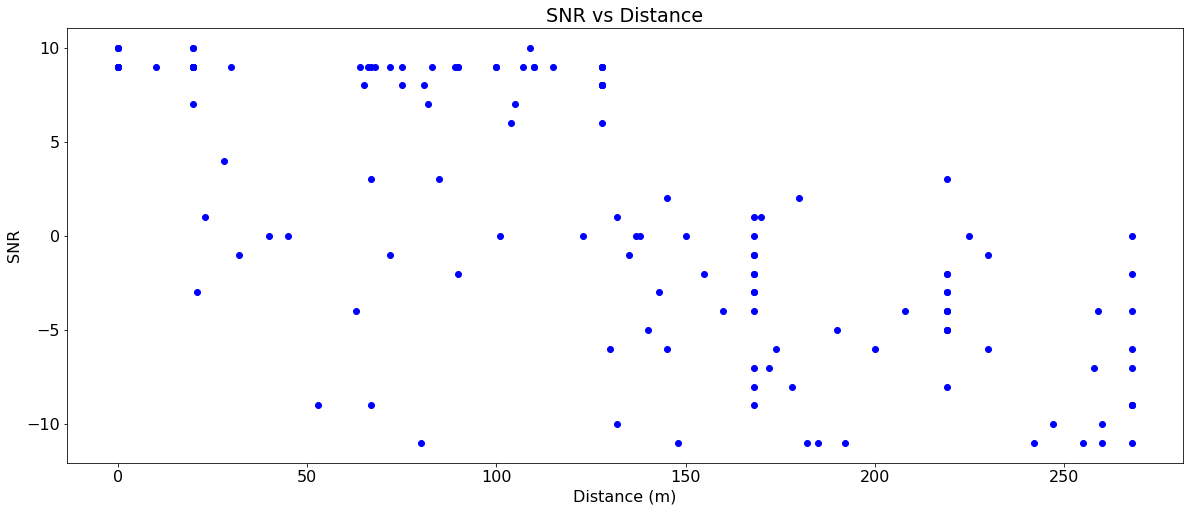
- For a particular distance, our Lora module exhibits multiple packet strength values. During the course of the experiment, we noticed that the packet strength value keeps changing even though the Transmitter and the Receiver stay stationary. A plausible argument is required to verify this behavior.
Developing Article
Rishiraj Adhikary
Twitter
Github
Website
Blog Posts
Rishiraj is a Research Assistant in CS department at IIT Gandhinagar. He is working under Prof. Nipun Batra.
Sumit Kanu
Twitter
Github
Website
Blog Posts
Sumit is a summer intern at the Sustainability Lab, IIT Gandhinagar