
Rithwik Kukunuri
9 min read.
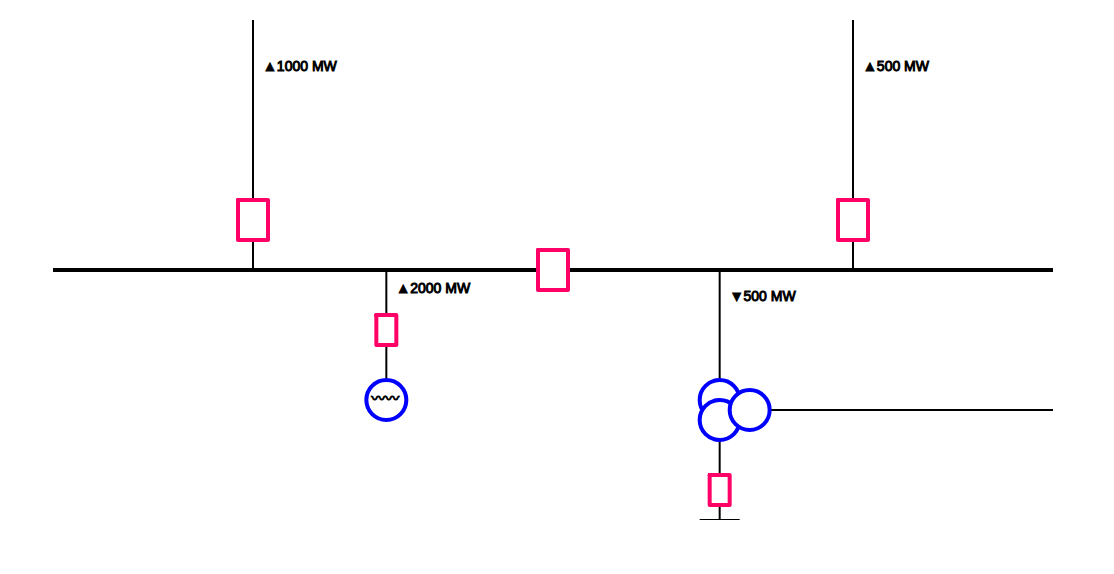
This blog mainly explains the use of SVG.js to display real-time data on diagrams. By the end of this blog post, we will be able to create the following interface.
The above diagram shows a single line diagram, which is a representation of a power system using the simple symbol for each component. A single line diagram of a power system is the network which shows the connections and arrangement of the system components along with their data (such as output rating, voltage, resistance, and reactance, etc.).
Examples of applications where these visualizations can be useful:
- Traffic flow
- Network flow
- Water flow
- ….
We will be using SVG.js for the application.
The values displayed refresh every second. HTML, CSS, and JS are necessary prerequisites. So, let us get started.
<!DOCTYPE html>
<html lang="en">
<head>
  <title>Clock Example</title>
  <meta charset="utf-8">

  <meta name="viewport" content="width=device-width, initial-scale=1">
  <link rel="stylesheet" href="https://maxcdn.bootstrapcdn.com/bootstrap/3.4.0/css/bootstrap.min.css">
  <script src="https://ajax.googleapis.com/ajax/libs/jquery/3.4.0/jquery.min.js"></script>
  <script src="https://maxcdn.bootstrapcdn.com/bootstrap/3.4.0/js/bootstrap.min.js"></script>
  <script src="svg.js"></script><!--Path to the external svg.js library-->
</head>
<body>
    <div class="container" style="padding:2em;" id="myDiv">
        <svg  class="drawing" id="drawing" width="1000" height="500" >
        </svg>
</div>
</body>
The above block contains the starter template bootstrap code. We will be using an external JS library called svg.js. Download it and change add JS reference to it inside head tag. We will now use JS to create the interface with which we can create custom shapes.
I also commented on the code blocks. Start a discussion inside Disqus form below if you get stuck.
The code block below creates a canvas.
<script>
var x = document.getElementById("drawing").clientWidth;
var y = document.getElementById("drawing").clientHeight;
var draw = SVG("drawing").size(x, y)
</script>
Below are the functions that we are going to use. These functions are built over the SVG.js.
<script>
function draw_line(canvas,start_x, start_y,end_x,end_y, width=2) {
    //Draws a line between (start_x,start_y) and (end_x, end_y)
    var line = canvas.line(start_x, start_y, end_x, end_y).stroke({ width: width })
}

function draw_rectangle(canvas,center_x,center_y,width,height,color){

    //Draws a rectangle with (center_x,center_y) as the center
    var w_ = width/2;
    var h_ = height/2;
    var polyline = draw.polyline([[center_x-w_,center_y-h_],
                                   [center_x-w_,center_y+h_],
                                   [center_x+w_,center_y+h_],
                                   [center_x+w_,center_y-h_],
                                   [center_x-w_,center_y-h_]])
    polyline.fill(color)
    polyline.stroke({ color: "#f06", width: 4, linecap: "round", linejoin: "round" })

}

function draw_circle(canvas,center_x,center_y,radius,width){
    //Draws a circle with center_x and center_y as the centers
    var circle = canvas.circle(2*radius).center(center_x,center_y)
    circle.fill("white")
    circle.stroke({ color: "blue", width: width, linecap: "round", linejoin: "round" })
}

function draw_text(text,x,y){
    //Puts text at (x,y)
    var text1 = draw.text(text).move(x,y).stroke({width:1})
}
</script>
Since, we know what functions are to be used, we just need to play around with numbers(Trying and changing the positions of the boxes) to make the interface. First, let us finish off the horizontal line and vertical lines.
<script>

var x_pos_line1 = x/5// Distance from left side of the canvas for the vertical line
var line_y_coor = y/2// Distance from top of the screen for the horizontal line

draw_line(draw,0, line_y_coor, x, line_y_coor,4)//Horizontal Line
draw_line(draw,x_pos_line1, line_y_coor, x_pos_line1, 0)//Line with Power 75MW
draw_line(draw,x-x_pos_line1, line_y_coor, x-x_pos_line1, 0)//Line with Power 85MW

</script>
Now, let us draw the rectangles over them.
<script>

draw_rectangle(draw,x_pos_line1,line_y_coor - 50,30,40,"white");//Drawing a rectangle over the  75MW line
draw_rectangle(draw,x - x_pos_line1,line_y_coor - 50,30,40,"white");//Drawing a rectangle over the  85MW line
draw_rectangle(draw,x/2,line_y_coor,30,40,"white");//Drawing a box over the horizontal line

</script>
Now, let us finish off the bottom lines and rectangles. Also, feel free to experiment with the positions of the lines and boxes.
<script >

var x_pos_line2 = x/3

draw_line(draw,x_pos_line2, line_y_coor, x_pos_line2, y - 100)//2000W line
draw_line(draw,x - x_pos_line2, line_y_coor, x - x_pos_line2, y)//1100MW line
draw_line(draw,x-x_pos_line2+50,y - 110, x,y - 110)//Line from the circles

draw_rectangle(draw, x_pos_line2, line_y_coor + 60, 20, 30,"white")
draw_rectangle(draw, x-x_pos_line2, y - 30, 20, 30,"white")//Lower most rectangle

draw_line(draw,x - x_pos_line2 - 20, y, x - x_pos_line2 + 20 ,y)//Bottom Right Horizontal line. Ground Line

</script>
Use the below code block to draw the circles.
<script>

draw_circle(draw,x_pos_line2,y - 120 ,20,4)

draw_circle(draw,x-x_pos_line2,y - 120 ,20,4)//Overlapping circles
draw_circle(draw,x-x_pos_line2,y - 100 ,20,4)//Overlapping circles
draw_circle(draw,x-x_pos_line2+30,y - 110 ,20,4)//Overlapping circles

</script>
Now, let us put some text over the interface. The readings here display the direction and magnitude of power. Also, these values change once every 1s.
<script >

var total = 2000

draw_text("〰〰",x_pos_line2-15,y - 130);
draw_text("▲"+total+" MW",x_pos_line2+10,line_y_coor+10);


var t1 = draw_text("",x_pos_line1+10,30);
var t2 = draw_text("",x - x_pos_line1+10,30);
var t3 = draw_text("",x - x_pos_line2+10,line_y_coor+10);

window.setInterval(function(){
  // t1, t2, and t3 are the text objects
  // In this function, we modify the text attribute for each of the readings.

  //Generate random readings
  var reading1 = 100*Math.ceil(Math.random()*10)
  var reading2 = 100*Math.ceil(Math.random()*10)
  var reading3 = total - reading1 - reading2

  // Modify the text objects
  t1.text("▲"+reading1+" MW");
  t2.text("▲"+reading2+" MW");
  t3.text("▼"+reading3+" MW");

}, 1000);//Refresh time in ms

</script>
Now, we have a single line diagram that shows the power consumed by each of the loads in the circuit. You can create more complex circuits using the method described above. Playing with numbers is all you need to do. Also, check out the original API by SVG.js.
A few exercises to try after building this application:
- Adding images to the canvas - Refer to API
- Make the diagram page responsive (need to choose the line offsets based on screen size) - This is might take some time
Link to the web application. By the way, it is page responsive.
Some other cool things you can build:
- Creating a pendulum animation.
- Creating a clock.
Rithwik Kukunuri
Twitter
Github
Website
Blog Posts
Rithwik is a Computer Science undergrad at IIT Gandhinagar. He is currently working with Prof. Nipun in the field of Machine Learning.