URL
URL of the tool: https://microsoft.github.io/satellite-imagery-labeling-tool/src/labeler.html
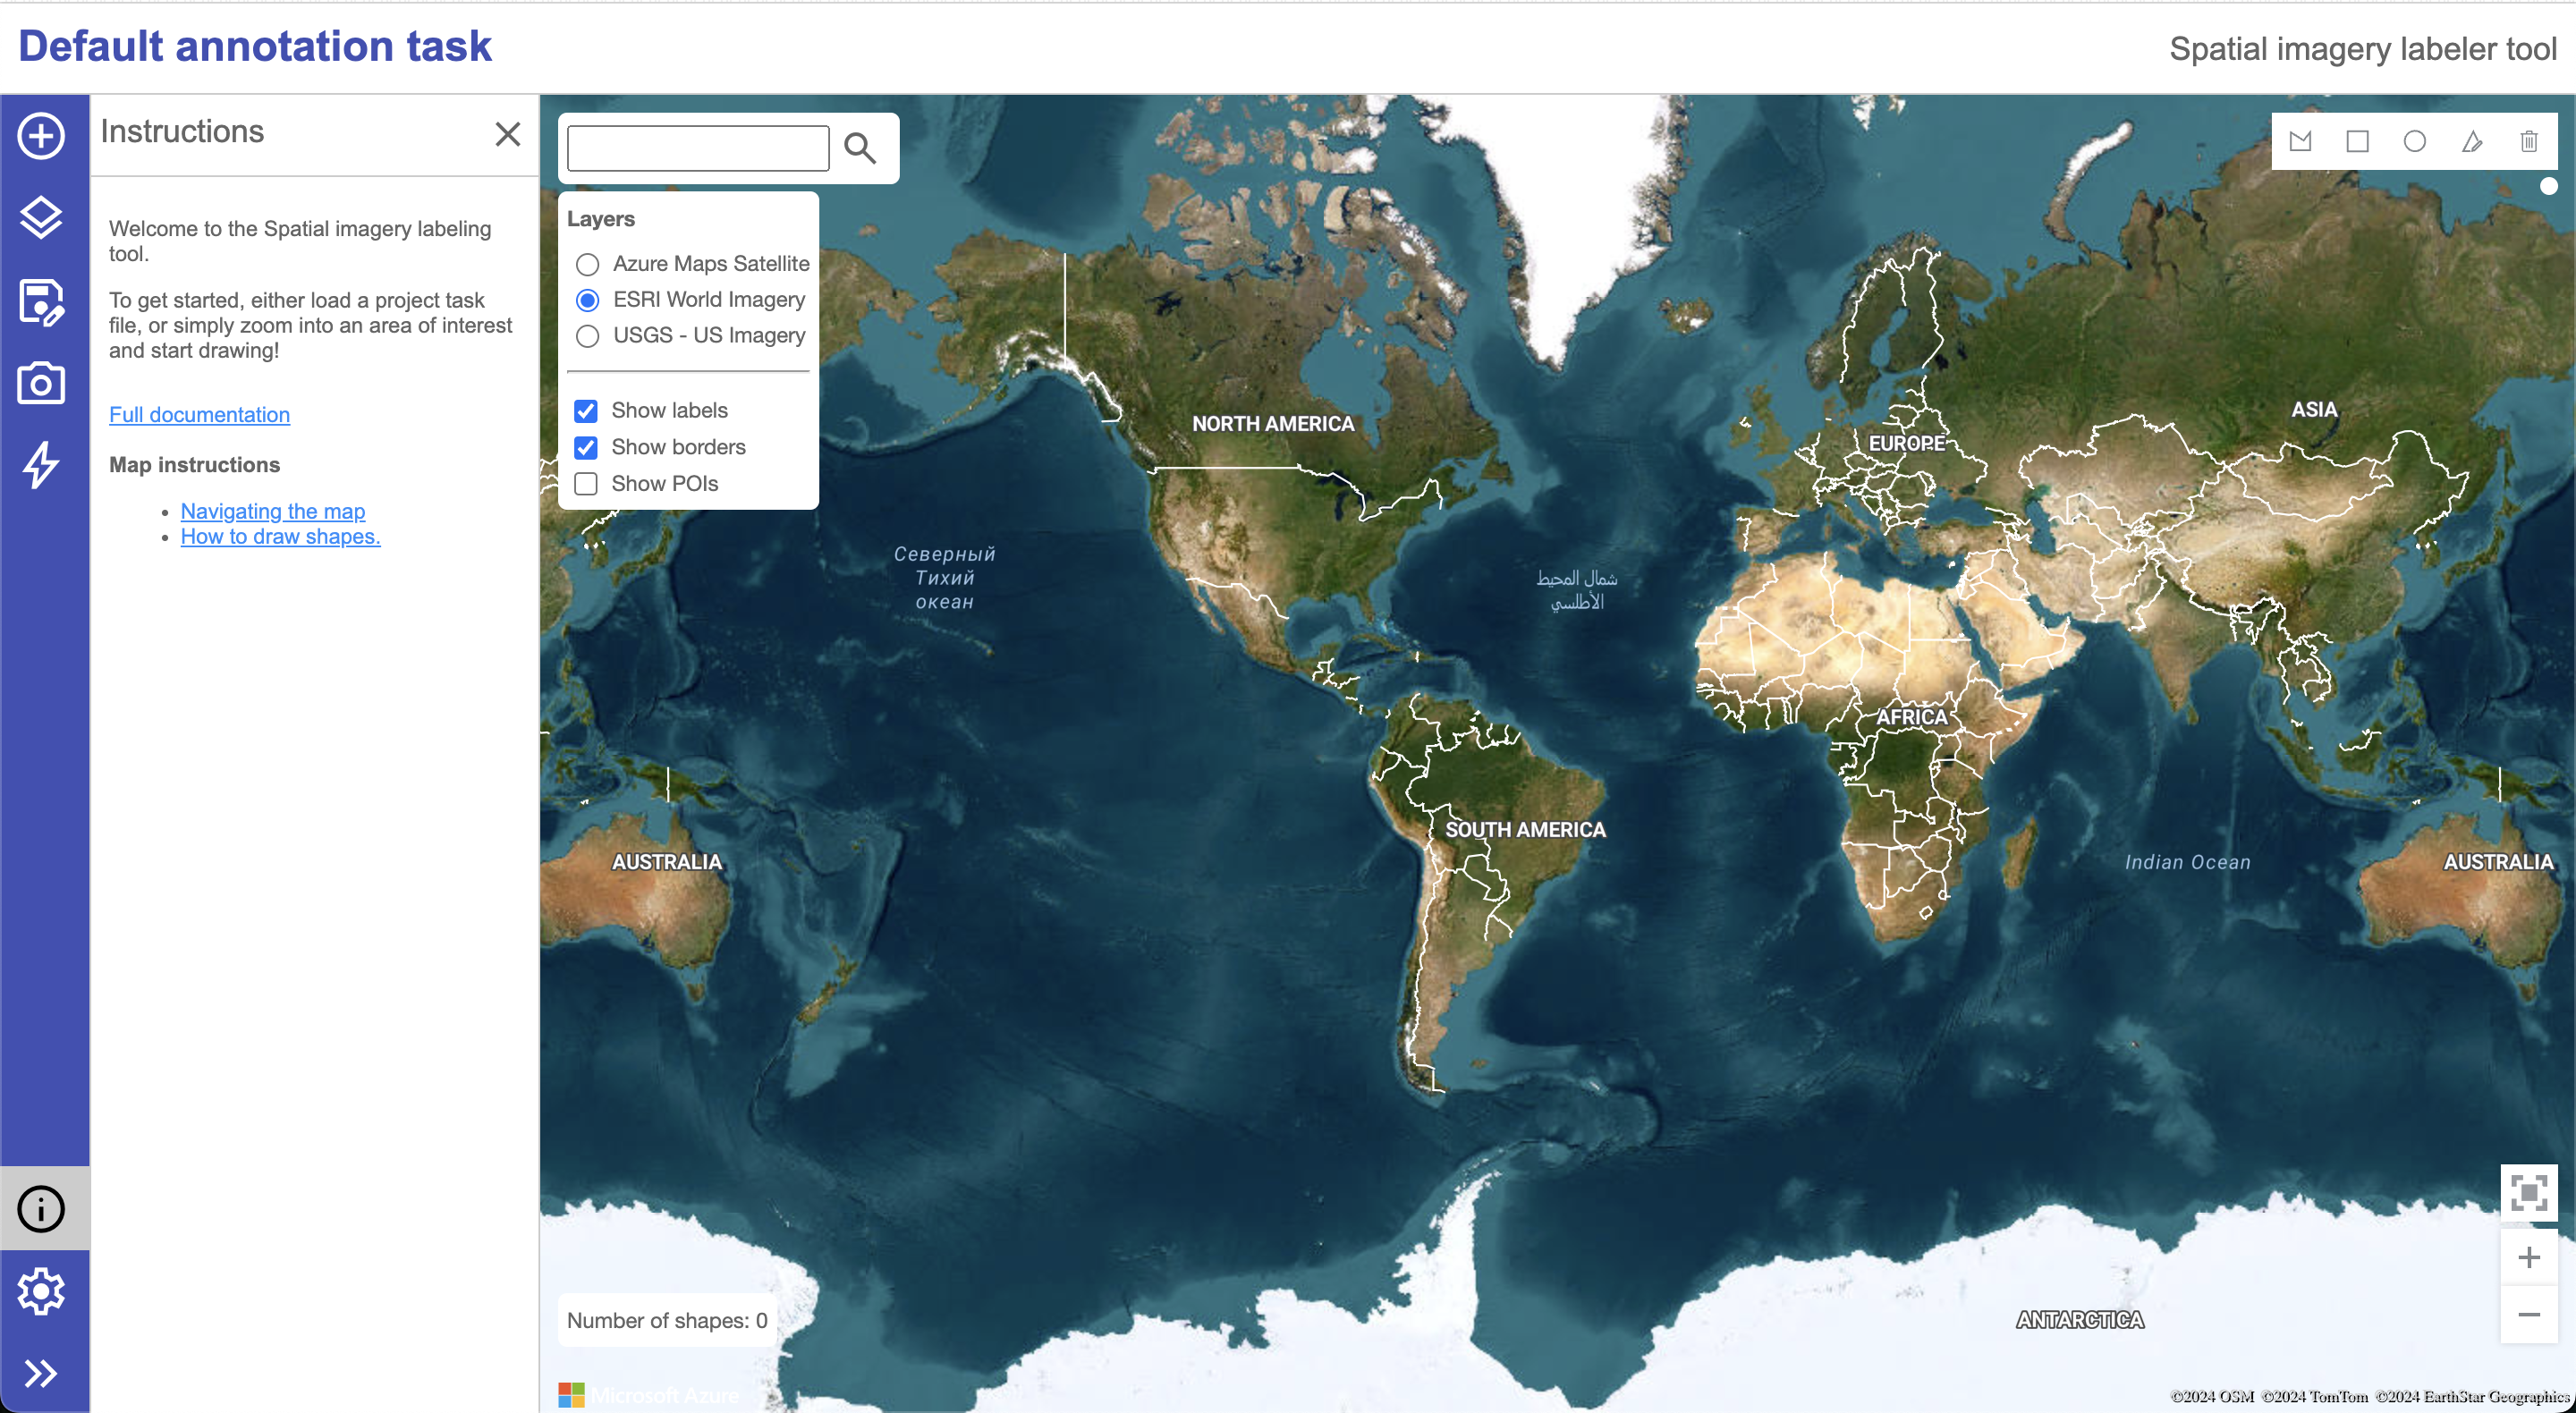
Full interface of Microsoft Labeling Tool

Label Format
Here is an example label generated and saved as GeoJSON from the tool.
{
    "type": "FeatureCollection",
    "features": [
        {
            "type": "Feature",
            "properties": {
                "source": "Drawn|Azure Maps Satellite",
                "class": "Zigzag",
                "secondary_class": null,
                "task_name": "Kilns_1"
            },
            "geometry": {
                "type": "Polygon",
                "coordinates": [
                    [
                        [72.028406, 23.375271],
                        [72.03023, 23.375271],
                        [72.03023, 23.372317],
                        [72.028406, 23.372317],
                        [72.028406, 23.375271]
                    ]
                ]
            }
        },
        {
            "type": "Feature",
            "properties": {
                "source": "Drawn|Azure Maps Satellite",
                "class": "FCBK",
                "secondary_class": null,
                "task_name": "Kilns_1"
            },
            "geometry": {
                "type": "Polygon",
                "coordinates": [
                    [
                        [72.028942, 23.378817],
                        [72.03377, 23.378817],
                        [72.03377, 23.376749],
                        [72.028942, 23.376749],
                        [72.028942, 23.378817]
                    ]
                ]
            }
        }
    ]
}
Breaking down the meaning
The following part is the template
{
    "type": "FeatureCollection",
    "features": [
        {
            "type": "Feature",
            "properties": {
                "source": <source>,
                "class": <class_name>,
                "secondary_class": <secondary_class>,
                "task_name": <task_name>
            },
            "geometry": {
                "type": "Polygon",
                "coordinates": <coordinates>,
            }
        }
    ]
}
Now understanding the meaning of each field:
| Field | Description |
|---|---|
source |
The source of the image on which the label is drawn. If it is drawn on the Azure Maps Satellite, then it will be Drawn|Azure Maps Satellite. |
class |
The class name of the label. For example, Zigzag, FCBK, etc. |
secondary_class |
The secondary class of the label. It is optional. |
task_name |
The name of the task. For example, Kilns_1. |
coordinates |
The coordinates of the polygon drawn. It is an array of coordinates. Each coordinate is an array of two elements, longitude, and latitude. The last coordinate should be the same as the first coordinate to close the polygon. |
How to view already labeled data
- Click on the Plus-like icon from the left panel.
- Select
Local data file - Choose the
GeoJSONfile that you want to view. - You will see that
Number of shapesis updated to the number of shapes in the file. - Click on the button just above the Zoom In/Out buttons to refocus the map to the labeled data.
- If the imagery is not visible, then reduce the zoom level.