import pandas as pd
import numpy as np
from vayu import calendarPlotCalendar Plot
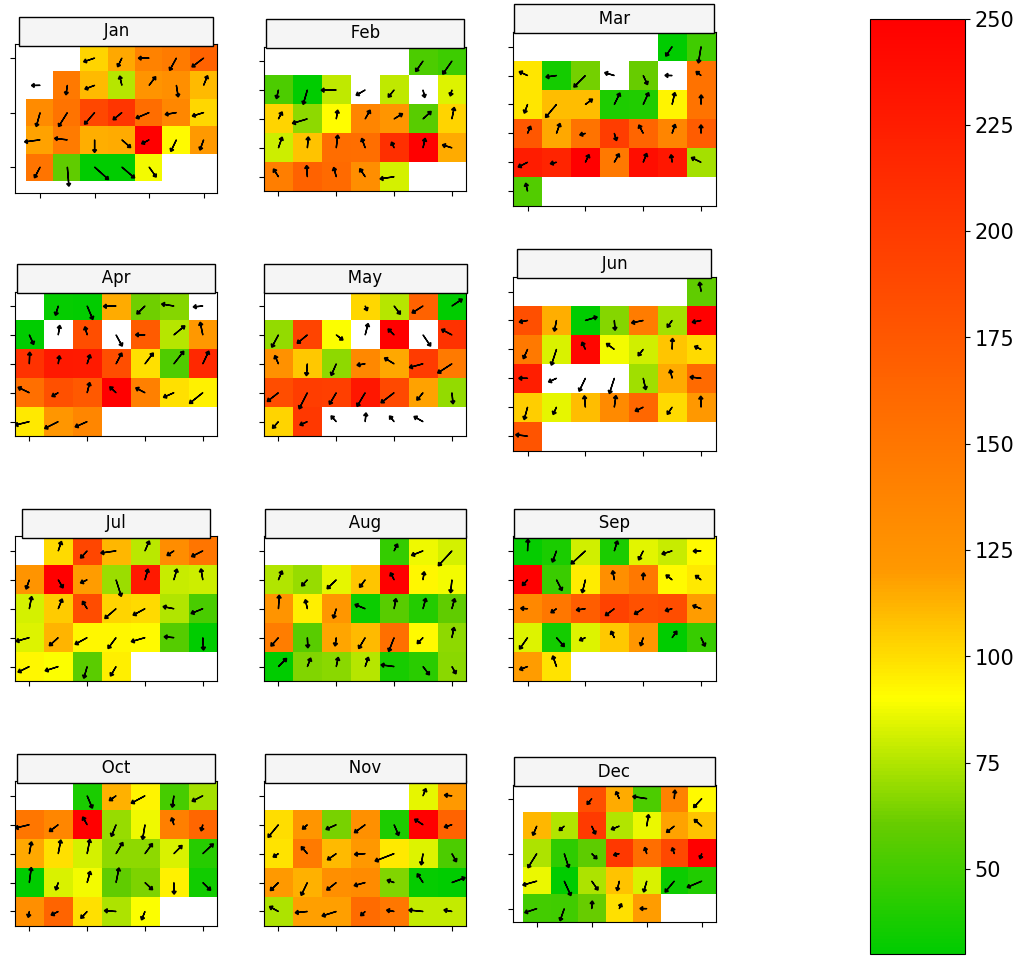
Sometimes it is useful to visualize data in a familiar way. Calendars are the obvious way to represent data for data on the time scale of days or months. The calendarPlot function provides an effective way to visualize data in this way by showing daily concentrations laid out in a calendar format. The concentration of a species is shown by its color.
Reading data.
df = pd.read_csv('data/mydata.csv.tar.gz')
df.head()| date | ws | wd | nox | no2 | o3 | pm10 | so2 | co | pm25 | |
|---|---|---|---|---|---|---|---|---|---|---|
| 0 | 01/01/1998 00:00 | 0.60 | 280.0 | 285.0 | 39.0 | 1.0 | 29.0 | 4.7225 | 3.3725 | NaN |
| 1 | 01/01/1998 01:00 | 2.16 | 230.0 | NaN | NaN | NaN | 37.0 | NaN | NaN | NaN |
| 2 | 01/01/1998 02:00 | 2.76 | 190.0 | NaN | NaN | 3.0 | 34.0 | 6.8300 | 9.6025 | NaN |
| 3 | 01/01/1998 03:00 | 2.16 | 170.0 | 493.0 | 52.0 | 3.0 | 35.0 | 7.6625 | 10.2175 | NaN |
| 4 | 01/01/1998 04:00 | 2.40 | 180.0 | 468.0 | 78.0 | 2.0 | 34.0 | 8.0700 | 8.9125 | NaN |
Converting date column to be of the type datetime64. And taking daily averages.
df['date']= pd.to_datetime(df['date'])
daily_df = df.groupby([df['date'].dt.date]).mean(numeric_only=True)
daily_df = daily_df.reset_index()
daily_df.head()| date | index | ws | wd | nox | no2 | o3 | pm10 | so2 | co | pm25 | |
|---|---|---|---|---|---|---|---|---|---|---|---|
| 0 | 1998-01-01 | 11.5 | 6.835 | 191.666667 | 153.954545 | 39.363636 | 6.869565 | 18.166667 | 3.152609 | 2.699239 | NaN |
| 1 | 1998-01-02 | 755.5 | 1.175 | 89.166667 | 149.375000 | 41.208333 | 2.250000 | 25.000000 | 4.862882 | 1.857882 | NaN |
| 2 | 1998-01-03 | 1427.5 | 6.750 | 232.500000 | 250.500000 | 51.500000 | 3.375000 | 23.416667 | 9.811528 | 2.984965 | NaN |
| 3 | 1998-01-04 | 2171.5 | 2.215 | 98.333333 | 239.541667 | 46.541667 | 1.875000 | 45.583333 | 21.792065 | 2.409271 | NaN |
| 4 | 1998-01-05 | 2891.5 | 3.570 | 325.416667 | 79.625000 | 34.333333 | 17.625000 | 23.000000 | 2.103958 | 0.930347 | 16.235294 |
Getting a date column
Note: Please note the datatypes of the different columns.
calendarPlot(df, pollutant='pm25', year='2003', country='India');/home/patel_zeel/miniconda3/lib/python3.9/site-packages/vayu/calendarPlot.py:99: FutureWarning: Indexing a DataFrame with a datetimelike index using a single string to slice the rows, like `frame[string]`, is deprecated and will be removed in a future version. Use `frame.loc[string]` instead.
df_year = df[year].resample("1D").mean()