import pandas as pd
import matplotlib.pyplot as plt

from vayu import pollutionRosePollution Rose
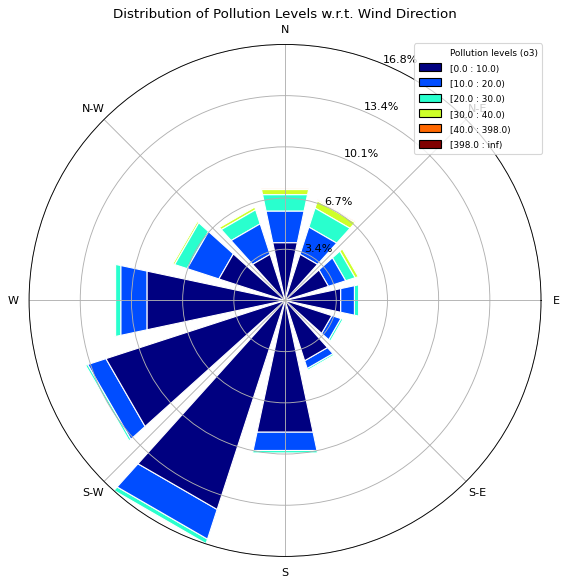
The traditional wind rose plot plots wind speed and wind direction. The “Pollution Rose” plot in vayu has the same structure but replaces wind speed with pollutants.
Loading the data
df = pd.read_csv("data/mydata.csv.tar.gz")
df.head()| date | ws | wd | nox | no2 | o3 | pm10 | so2 | co | pm25 | |
|---|---|---|---|---|---|---|---|---|---|---|
| 0 | 01/01/1998 00:00 | 0.60 | 280.0 | 285.0 | 39.0 | 1.0 | 29.0 | 4.7225 | 3.3725 | NaN |
| 1 | 01/01/1998 01:00 | 2.16 | 230.0 | NaN | NaN | NaN | 37.0 | NaN | NaN | NaN |
| 2 | 01/01/1998 02:00 | 2.76 | 190.0 | NaN | NaN | 3.0 | 34.0 | 6.8300 | 9.6025 | NaN |
| 3 | 01/01/1998 03:00 | 2.16 | 170.0 | 493.0 | 52.0 | 3.0 | 35.0 | 7.6625 | 10.2175 | NaN |
| 4 | 01/01/1998 04:00 | 2.40 | 180.0 | 468.0 | 78.0 | 2.0 | 34.0 | 8.0700 | 8.9125 | NaN |
Now, we plot the pollution rose for pm25, pm10 and o3.
pollutionRose(df, pollutant='pm25');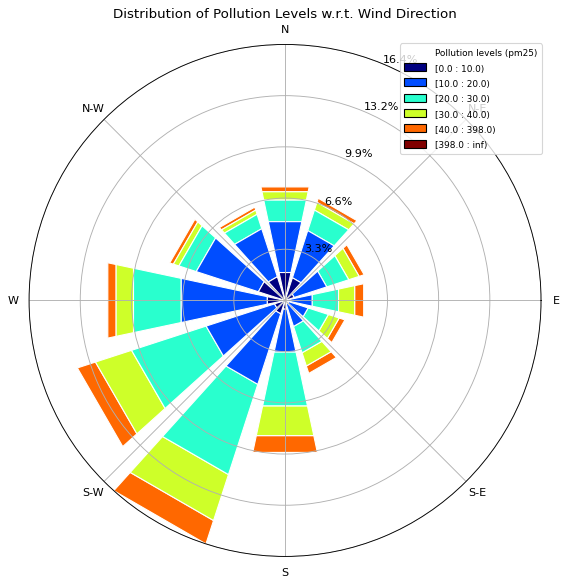
pollutionRose(df, pollutant='pm10');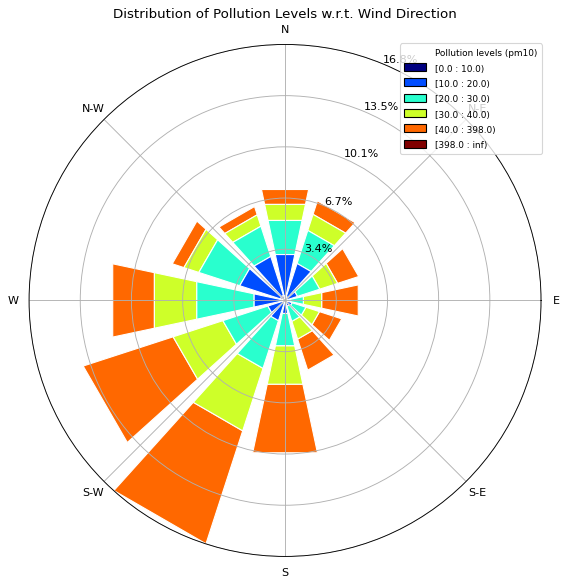
pollutionRose(df, pollutant='o3');